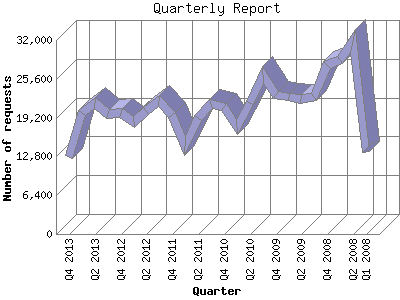
The Quarterly Report shows total activity on your site for each quarter of a
year. Remember that each page hit can result in several server requests as the
images for each page are loaded.
Note: Most likely, the first and
last quarters will not represent a complete quarter's worth of data, resulting
in lower hits.
| Quarter | Number of requests | Number of page requests | |
|---|---|---|---|
| 1. | Q1 2008 | 13,515 | 1,078 |
| 2. | Q2 2008 | 31,819 | 3,353 |
| 3. | Q3 2008 | 28,648 | 2,956 |
| 4. | Q4 2008 | 27,917 | 3,124 |
| 5. | Q1 2009 | 22,611 | 3,137 |
| 6. | Q2 2009 | 22,212 | 3,429 |
| 7. | Q3 2009 | 22,571 | 3,387 |
| 8. | Q4 2009 | 22,867 | 3,411 |
| 9. | Q1 2010 | 26,233 | 4,036 |
| 10. | Q2 2010 | 21,597 | 3,799 |
| 11. | Q3 2010 | 17,619 | 2,169 |
| 12. | Q4 2010 | 20,942 | 2,800 |
| 13. | Q1 2011 | 21,386 | 2,977 |
| 14. | Q2 2011 | 19,086 | 2,710 |
| 15. | Q3 2011 | 14,576 | 2,524 |
| 16. | Q4 2011 | 19,683 | 2,832 |
| 17. | Q1 2012 | 21,991 | 2,801 |
| 18. | Q2 2012 | 20,285 | 3,176 |
| 19. | Q3 2012 | 18,536 | 3,617 |
| 20. | Q4 2012 | 19,939 | 4,295 |
| 21. | Q1 2013 | 19,737 | 5,090 |
| 22. | Q2 2013 | 21,539 | 5,686 |
| 23. | Q3 2013 | 19,984 | 5,384 |
| 24. | Q4 2013 | 12,692 | 3,464 |
Most active quarter Q2 2013 : 5,686 pages sent. 31,819 requests handled.
Quarterly average: 3,384 pages sent. 21,166 requests handled.
This report was generated on December 11, 2013 12:25.
Report time frame March 11, 2008 00:36 to December 10, 2013 23:22.
| Web statistics report produced by: analog 6.0 / Report Magic 2.21 |